
TEWBLOG is a Windows application that allows you to log data from your Tech Edge Wide Band 02 Lambda Meter. For more information on the Tech Edge Wide Band, please visit their web site at: http://www.wbo2.com
The Tech Edge Wide Band 02 Lambda Meter was one of the first available low cost DIY wide band oxygen sensor controllers, they are easy to build, and much less expensive than most of the other Lambda meters that are out there. After the v1.5 lambda meter was released, I decided it would be nice to have a powerful application that would make tuning my car easier. I found that looking over at the display while driving was somewhat dangerous, and wasn't a really accurate way to tune.
TEWBLOG has the following features to make tuning and monitoring your vehicles performance simple:
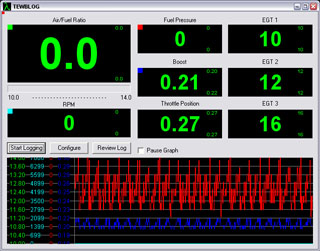
- Large, easy to read "gauges" that display
the data coming back from the sensors in real time.
- A running
graph that plots the history of the gauges as the car is running.
This makes it simple to look back in time a few seconds as you are
driving.
- Completely configurable "gauges". Each of the
gauges can be configured to display the data from any type of sensor
that can be connected to the TE Wide Band device.
- Configurable
real-time graphs. Each of the graphs can be configured to display the
data how you like it to be displayed.
- Time-stamped data for the
TE-5301 and v1.5 meters. (Accurate to 10ms)
- Data is stored in a
simple CSV (comma separated value) for easy import into other
applications for analysis
- Support for all of the current
versions of the Tech Edge wide band hardware, including the original
TE-5301 display, the v1.5, and now the v2.0 hardware.
In addition to those features, the registered version of the software has the following features:
- No "Nag" screen when the program is
started! :-)
- On screen 2d graphical review of the logged
data, with the ability to zoom in/zoom out and look at specific
values at any point in the graph.
- Timestamp displayed as points
are selected in the graph.
- Fully configurable alarms. Alarms can
be defined based on one or more of the "gauges" being in a
specified range. Complex combinations of gauges can be combined to
make accurate alarms.
- AutoTrigger - A feature that allows you to
define the conditions (based on gauges) which will cause the software
to automatically start logging data.
- "Matrix" analysis
mode provides the ability to plot the collected data in a spreadsheet
style grid, with user defined plotting axes. For example, you could
plot the RPM vs Manifold Pressure (if so equipped) and plot the Air
Fuel ratio at the intersecting axis points.
Matrix Analysis Mode Screenshot: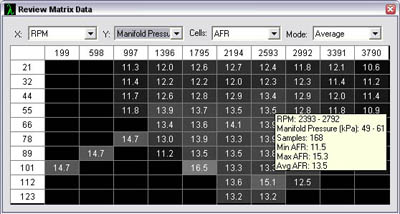
Downloading the software
For details about changes made to the latest version of TEWBLOG, click HERE!
Click
HERE to download the latest RELEASE version of TEWBLOG! (2.1e)
Using TEWBLOG
Click HERE to DOWNLOAD the TEWBLOG PDF Users Guide
![]()